Whitepaper: comparing FitWise and MoCap suit 3D body predictions
How close is a body reconstructed from ordinary footage to one measured by a motion-capture suit? We put a single camera next to an Xsens suit, recorded nine athletes, reconstructed FitWise 3D poses, and compared them with what the suit predicted.
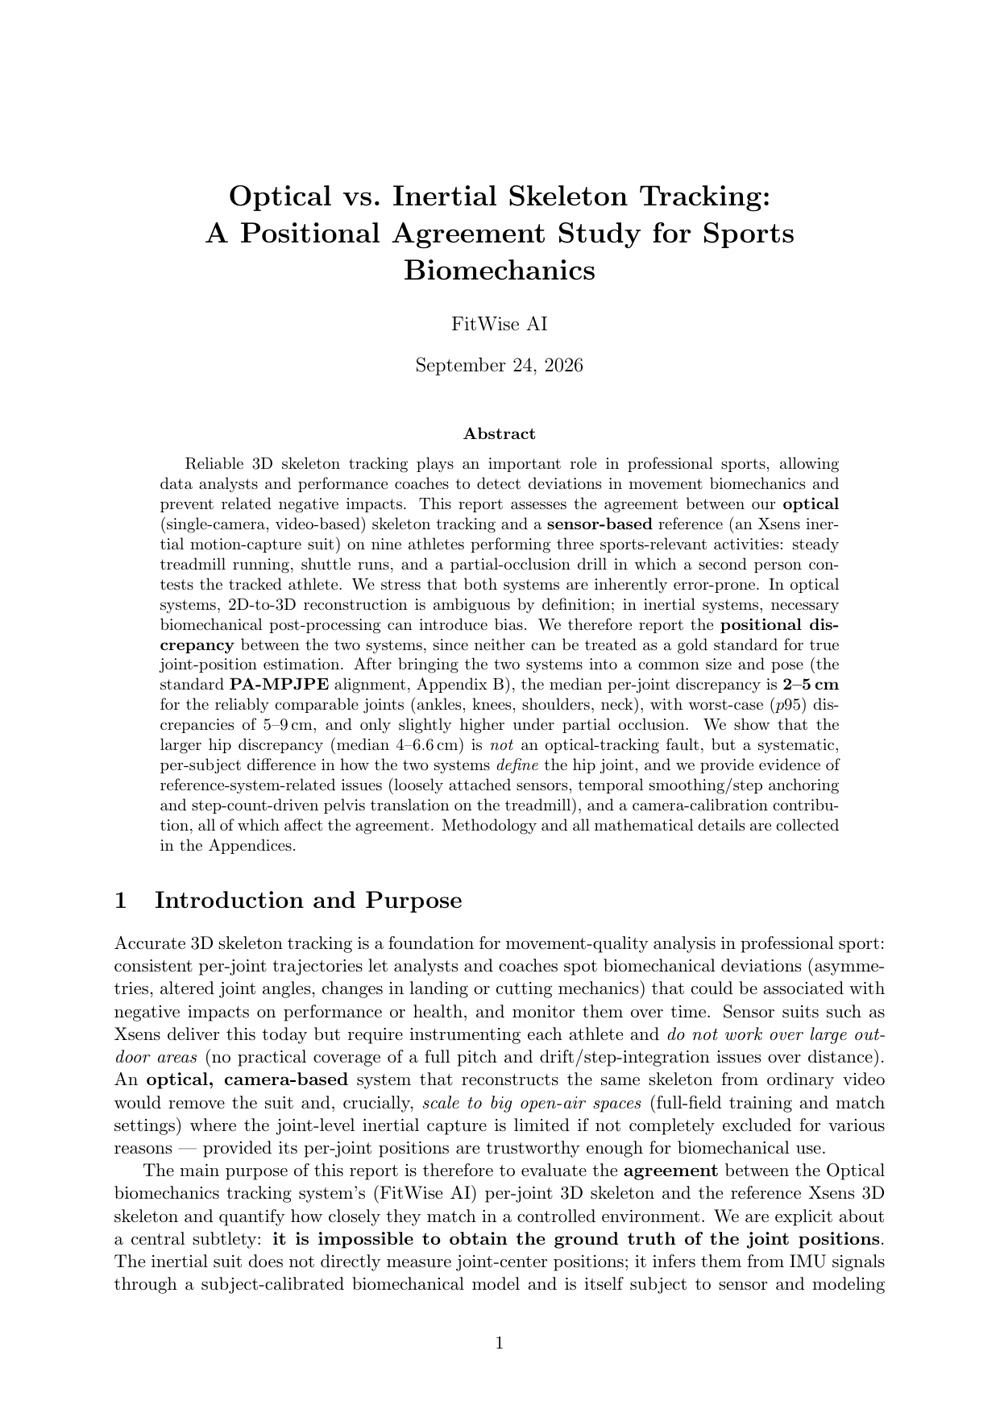
discrepancy
system
We compared FitWise
with a motion-capture suit in a lab
FitWise reconstructs the athletes in 3D from a video. Our system is agnostic to the camera model — so it can ingest any existing footage which has a good enough quality. This means we don't need to install any additional hardware, but poses an important question: how accurate are these results?
In July 2026, we compared our 3D poses with the predictions of a motion-capture suit. To do it, we booked a session at the CYENS studio in Nicosia, brought a camera, and put nine athletes in an inertial motion-capture suit. This way, their movements were recorded by two independent systems simultaneously.
MoCap suit
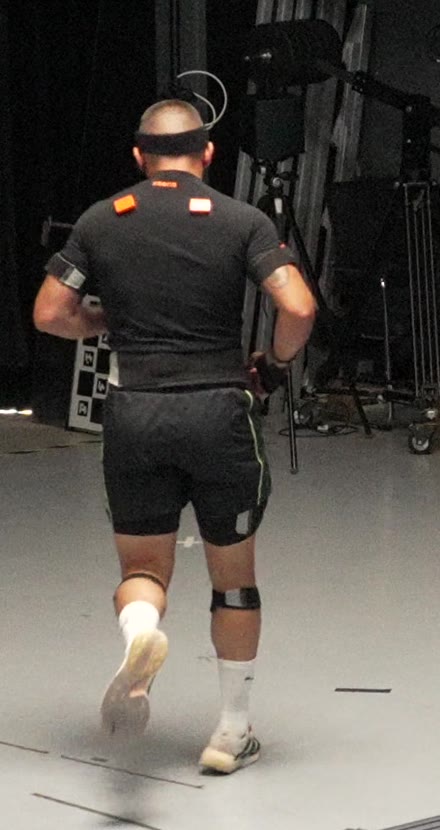
The reference is an Xsens inertial suit: seventeen small sensors strapped to the head, torso, upper arms, forearms, thighs, shins and feet, each combining an accelerometer, a gyroscope and a magnetometer at 60 Hz. After each athlete puts it on, their body dimensions are measured and a calibration pose is recorded, so that the sensor readings can be turned into a full biomechanical model. This is done by Xsens Analyze, which computes full-body motion from the measurements and the sensor data.
This means that the suit does not measure where a hip joint is. It infers joint centres from the sensors through its model of a human body and thus introduces its own modelling error. Our side is no different: recovering three dimensions from a single camera is ambiguous by definition and carries its own error. Neither system can be treated as a gold standard for where a joint actually is, so what follows compares two estimates rather than measuring ours against truth. Because of it, this page says discrepancy throughout rather than error.
Camera and its calibration
We installed an off-the-shelf camera in the corner of the studio: a Sony α6700 with the standard E PZ 16–50 mm F3.5–5.6 OSS II kit lens. It recorded HEVC 3840 × 2160 (4K) at 119.88 fps. We intentionally used a standard and popular consumer-grade camera.
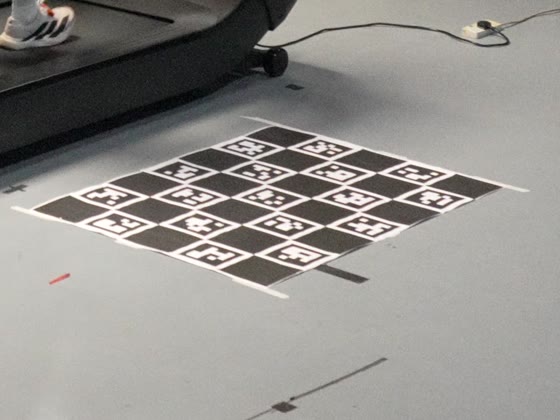
We opened the session with a calibration pass using a ChArUco board. When the FitWise system ingests footage from the field, we use the field markings themselves to calibrate the camera against real physical space. In the lab we don't have them — so instead we used the classic calibration procedure.
The second ChArUco board lay flat on the floor throughout the whole session.
Treadmill, shuttle, occlusion
Non-contact lower-body injuries cluster around high-speed running. We built our protocol around it, and also added occlusion to test how robust our system is against real game situations.
The athletes
Nine athletes, five men and four women, each taking all three activities in the same session. Every athlete wore the suit for every take, so each column below is one person measured three ways.
Measuring the discrepancy in 3D
The next step was to bring the two records together. We pulled the joint positions the suit had reconstructed from its sensors, ran our system over the footage of the same take, and lined the two up in time and space.
The results are below: our skeleton in black, and the one from the Xsens suit is in red.
Overlaid results
FitWise reconstructs not a skeleton but a full parametric 3D body from the footage. In this study, we only use 24 joint centres.
How the two skeletons are compared
Time alignment. The camera and the suit run on independent clocks at different rates. The offset is recovered from the motion itself. This step is very important, as shifting the alignment by one frame moves the result by about half a centimetre.
Spatial alignment. We rescale the skeleton by a single size factor shared across the whole clip, then rotate and shift it in the 3D space onto the Xsens skeleton.
Measure the 3D distance. For each frame, we compute the distance between our joint and its matching point on the suit's skeleton.
Skeleton comparison
Joint-by-joint discrepancy
The neck (the midpoint between the two shoulders) is the tightest and the most stable: 2–2.1 cm in all three activities. The shoulders sit above it at 2.3–4 cm. The knees measure at 2.9–3.2 cm, and the ankles show the largest discrepancy of 4.7–5.3.
| Joint | Treadmill (cm) | Shuttle run (cm) | Occlusion (cm) |
|---|
We describe the full process and results in the technical report below: how the skeletons were synchronised and aligned, the per-joint results for all three activities, the evidence of reference-side effects in the suit's own export, and what this study can and cannot claim.
preview